

Microsoft Excel is a program that everyone has encountered at least a few times in their lives. This is not surprising since Excel is a spreadsheet and data storage program that is especially popular and convenient in the corporate environment. Microsoft has added many tools to help people with disabilities use Excel.
One of these tools is Alt Text, which helps people with disabilities use Excel. You can add Alt Text to any element of your Excel document. You can add it to a cell, a picture, or a chart. Let’s take a closer look at how this works.
How to edit alt text to a chart in Excel
As I described above, you can add Alt Text to any element of your Excel spreadsheet. If you have compiled a chart based on the collected data, it’s also a good idea to add Alt Text. This will help you make the chart more suitable for people with visual problems. To do this, you will need to:
- Right-click on your finished chart.
- Choose Edit Alt Text (or View Alt Text) from the drop-down menu.
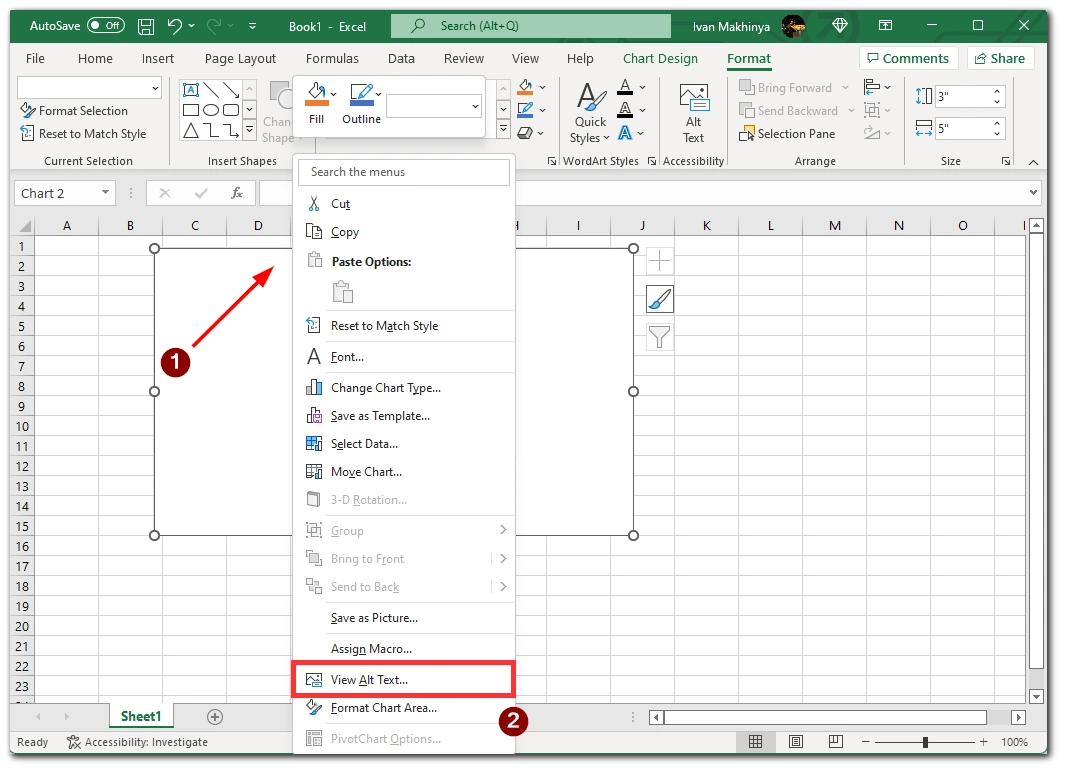
- On the right side of the screen, you will see a drop-down menu with a text box where you need to enter Alt Text.
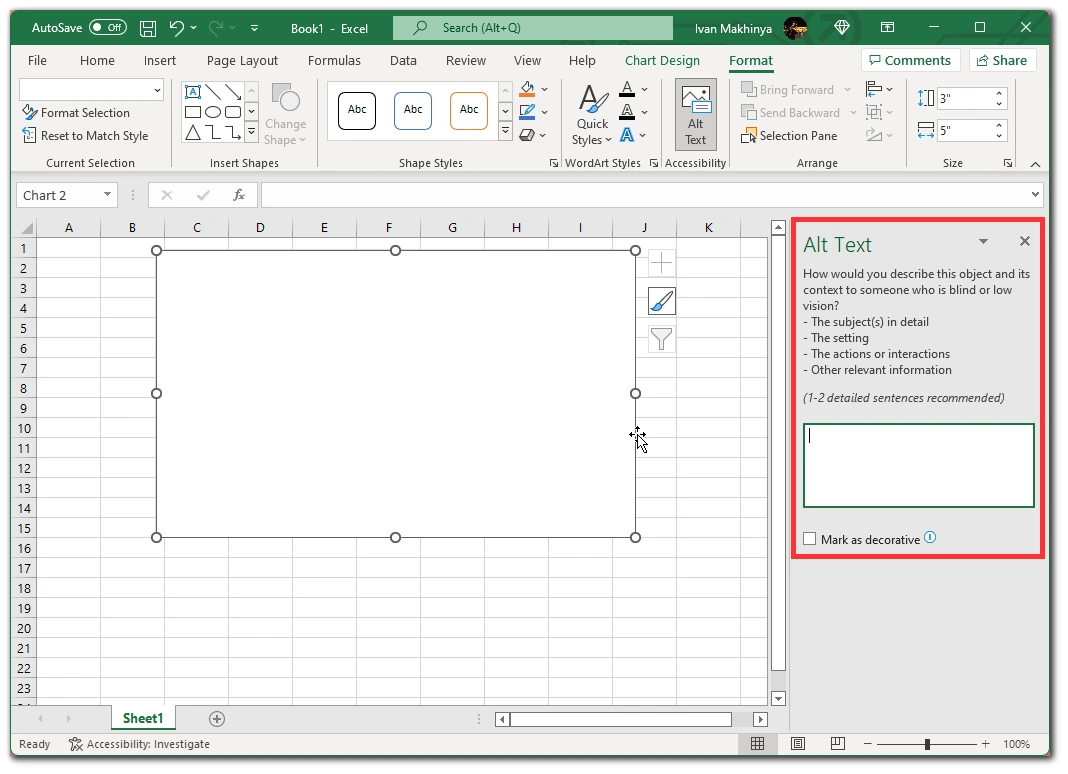
Note that the Alt Text should be as short and roomy as possible. It is also ideal if you do not put long words or complex phrases there. In addition, you need as much as possible to describe the meaning and the essence of the graph so that those who will use the Alt Text immediately understand what it’s about.
What is Excel alt text, and why do you need it?
Alt Text, as I wrote above, is one of the features designed for people with disabilities. It is a brief description of the elements or data in your table, which will come in handy if a visually impaired person handles your table.
If users use Screen Narrator, instead of just saying “Chart,” the Narrator will say your Alt Text. That way, even if the person can’t see your chart, they can understand what it means and what it’s for. This feature is quite handy and automatically works with many screen readers.
As I said, Alt text can be added to almost any element of your Excel document. You can attach it to text or a table, pictures, and graphics. The main thing to remember is that this text only needs to be produced by the screen reader. So it would be best to keep that in mind when writing it. Try to be concise and clear about what you’re attaching Alt Text to. Also, avoid complicated and ambiguous words so your description will be easier to understand.
How to create a chart in Excel
Since this article describes a way to add Alt Text specifically to charts, let’s take a closer look at how you can make a chart in Excel. The first thing you should start with is collecting data. It would be best to create a table where you put all your data so it can be formatted into a chart or graph. To do this, I recommend you start by dividing your data into columns and lines (conditional X and Y on your future chart). When your data is ready, you need to:
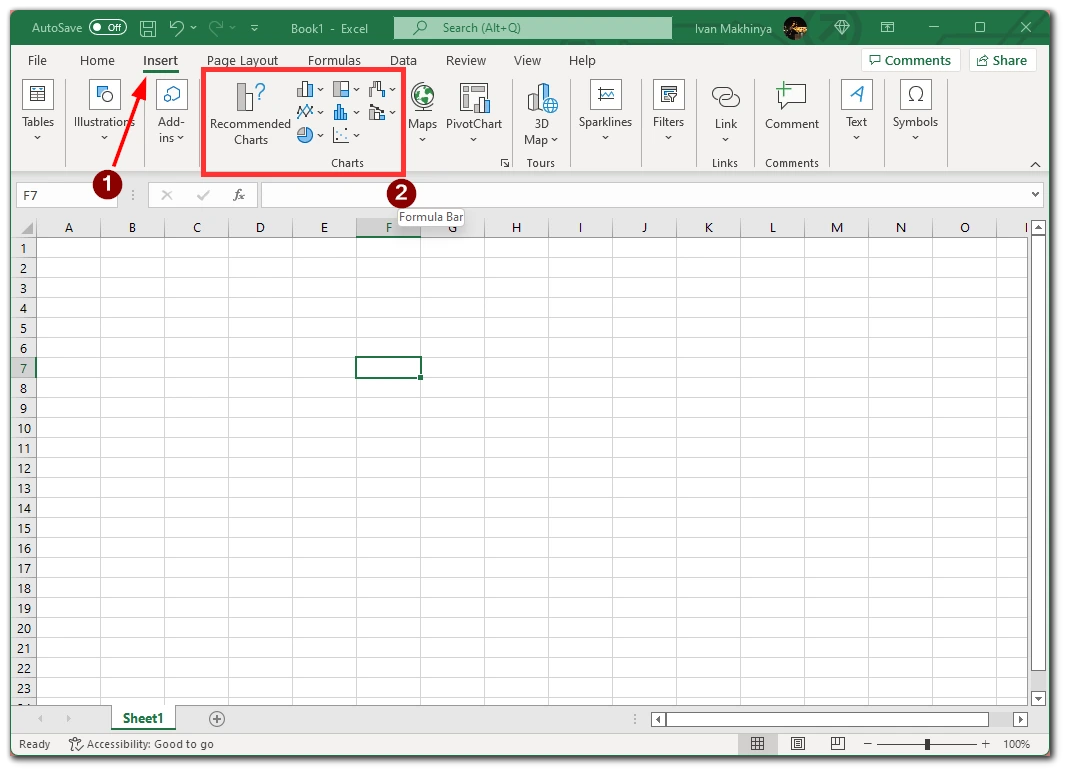
- Click on Insert on the toolbar above the Excel work page.
- Then in the Charts tab, select the chart you are interested in. Note that there are a lot of different charts and graphs. Look at each one carefully and choose the one that works best with your data.
- When your chart is created, you need to click on it and select the Select Data button in the toolbar.
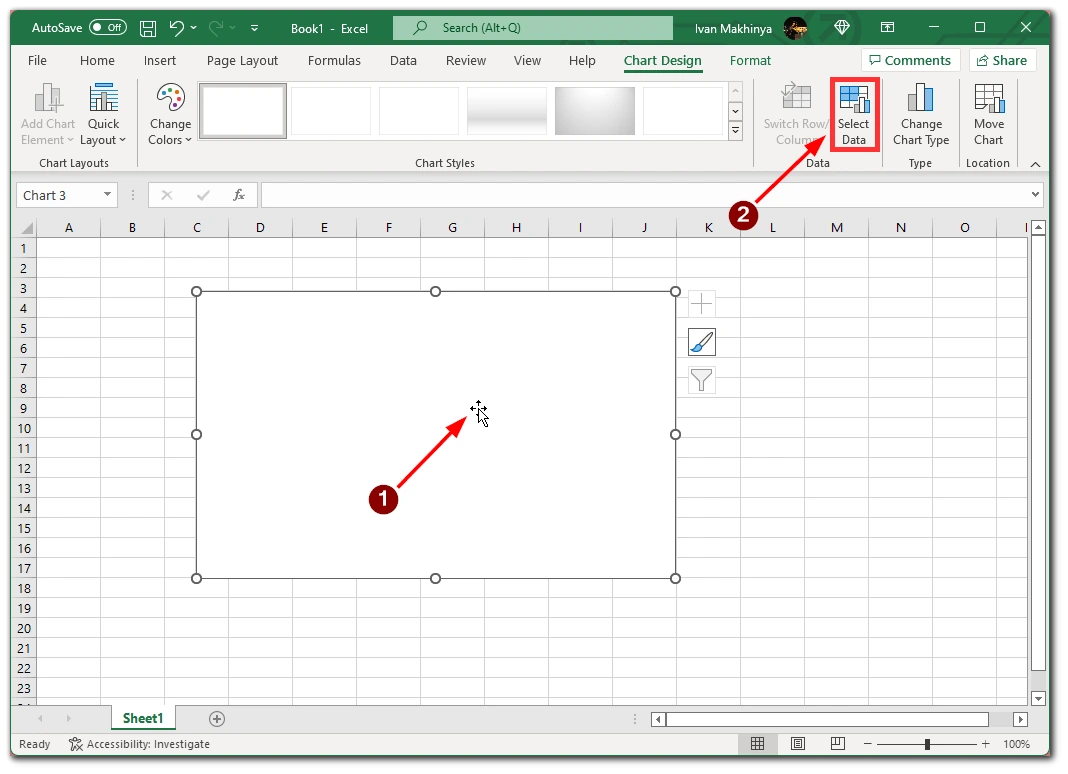
- After that, select the table you created before adding the chart. If you have done everything correctly, the diagram should fill in automatically.
Once you have connected the chart to your data, you can edit it. For example, you can use the Plus button to insert or remove items from the chart. You can also use the brush button to change the style and colors of the graph. Also note that if you change the data in your table, the graph will change in real-time. I recommend exploring the entire toolbar of your chart to make it as simple and attractive as possible.
What other ways to see or edit alt text in Excel?
There are two other alternative ways to view and edit your Alt Text if, for example, the right mouse button doesn’t work anymore. To do this, you need the created graph and the toolbar at the top of the excel. Next, you need the following:
Method 1
- Click on your Chart.
- Select the Format tab at the top of the screen.
- Then click the Alt Text button.
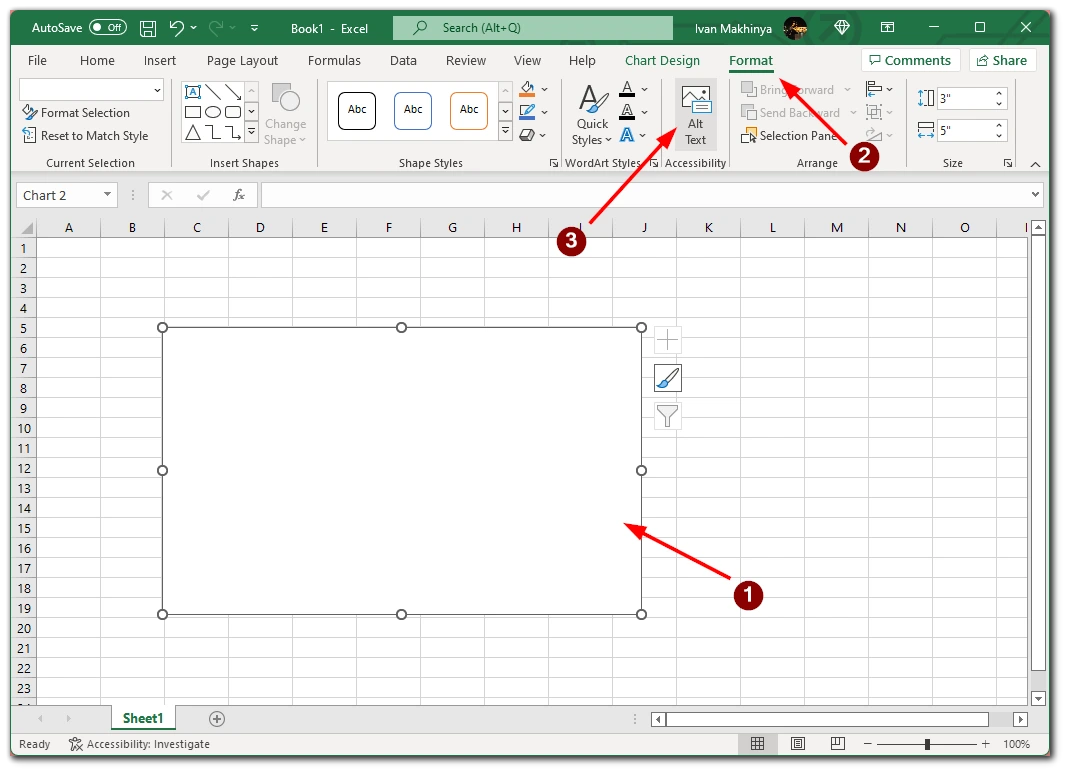
- The Alt Text box should open on the right side of the screen.
Method 2
- Click on your Chart.
- Then select the Review tab.
- This is where you need the Check Accessibility button located in the toolbar.
- In the pop-up menu, click on Alt Text.
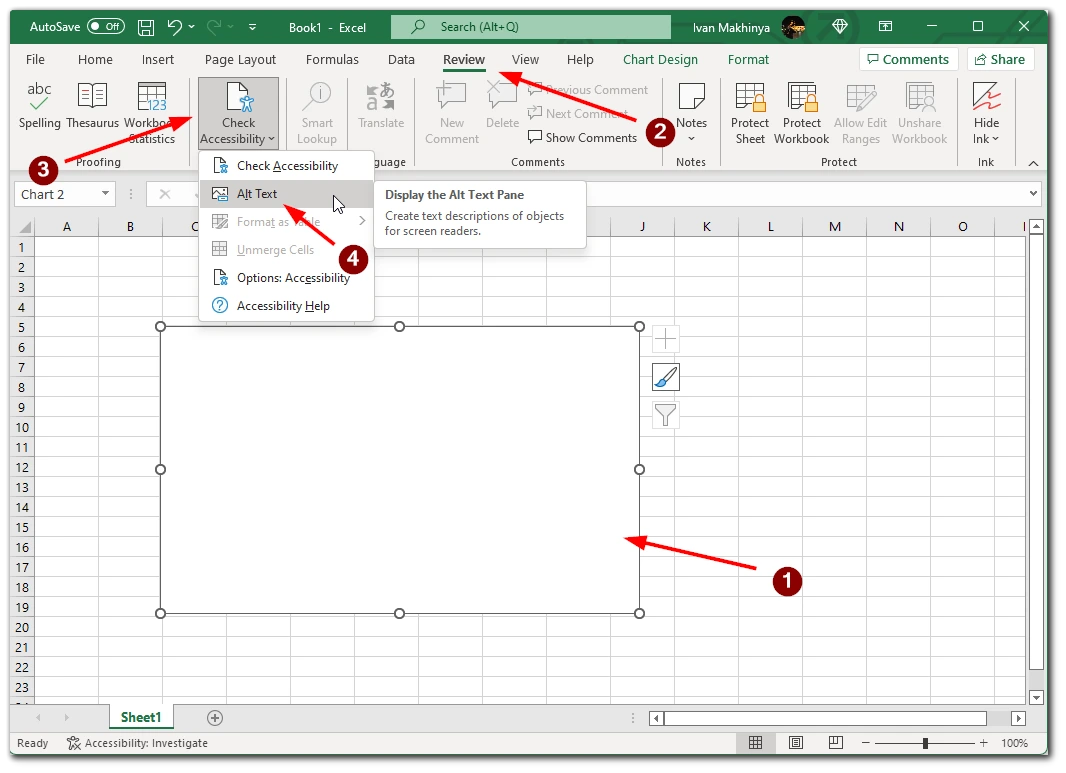
- You will then see a text box on the right where you can type your alt text.
All of these functions work similarly to what I described in the first paragraph, and they will allow you to edit alt text. Note that if you first edit the alt text with the right mouse button, any of these methods will open a ready-made alt text that you can modify or delete and write a new one.


